Spatial conservation prioritisation in data-poor countries: a quantitative sensitivity analysis using multiple taxa
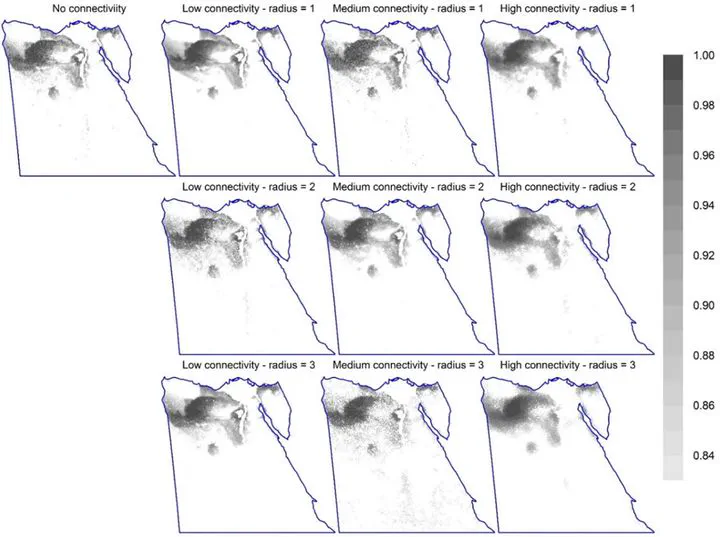 Connectivity
Background: Spatial conservation prioritisation (SCP) is a set of computational tools designed to support the efficient spatial allocation of priority areas for conservation actions, but it is subject to many sources of uncertainty which should be accounted for during the prioritisation process. We quantified the sensitivity of an SCP application (using software Zonation) to possible sources of uncertainty in data-poor situations, including the use of different surrogate options; correction for sampling bias; how to integrate connectivity; the choice of species distribution modelling (SDM) algorithm; how cells are removed from the landscape; and two methods of assigning weights to species (red-list status or prediction uncertainty). Further, we evaluated the effectiveness of the Egyptian protected areas for conservation, and spatially allocated the top priority sites for further on-the-ground evaluation as potential areas for protected areas expansion.
Results: Focal taxon (butterflies, reptiles, and mammals), sampling bias, connectivity and the choice of SDM algorithm were the most sensitive parameters; collectively these reflect data quality issues. In contrast, cell removal rule and species weights contributed much less to overall variability. Using currently available species data, we found the current effectiveness of Egypt’s protected areas for conserving fauna was low.
Conclusions: For SCP to be useful, there is a lower limit on data quality, requiring data-poor countries to improve sampling strategies and data quality to obtain unbiased data for as many taxa as possible. Since our sensitivity analysis may not generalise, conservation planners should use sensitivity analyses more routinely, particularly relying on more than one combination of SDM algorithm and surrogate group, consider correction for sampling bias, and compare the spatial patterns of predicted priority sites using a variety of settings. The sensitivity of SCP to connectivity parameters means that the responses of each species to habitat loss are important knowledge gaps.
See also:
- Appendix 2 of the paper
- A shiny app for priotization results of the 2,560 zonation runs and interactive spatial distribution of Egyptian fauna.