Dynamic species distribution models in the marine realm: predicting year-round habitat suitability of baleen whales in the Southern Ocean
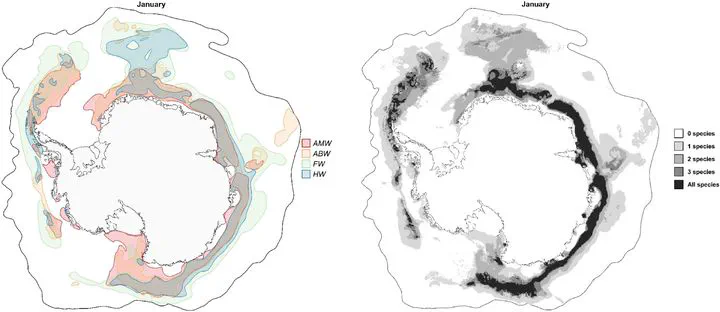
Species distribution models (SDMs) relate species information to environmental conditions to predict potential species distributions. The majority of SDMs are static, relating species presence information to long-term average environmental conditions. The resulting temporal mismatch between species information and environmental conditions can increase model inference’s uncertainty. For SDMs to capture the dynamic species-environment relationships and predict near-real-time habitat suitability, species information needs to be spatiotemporally matched with environmental conditions contemporaneous to the species’ presence (dynamic SDMs). Implementing dynamic SDMs in the marine realm is highly challenging, particularly due to species and environmental data paucity and spatiotemporally biases. Here, we implemented presence-only dynamic SDMs for four migratory baleen whale species in the Southern Ocean (SO): Antarctic minke, Antarctic blue, fin, and humpback whales. Sightings were spatiotemporally matched with their respective daily environmental predictors. Background information was sampled daily to describe the dynamic environmental conditions in the highly dynamic SO. We corrected for spatial sampling bias by sampling background information respective to the seasonal research efforts. Independent model evaluation was performed on spatial and temporal cross-validation. We predicted the circumantarctic year-round habitat suitability of each species. Daily predictions were also summarized into bi-weekly and monthly habitat suitability. We identified important predictors and species suitability responses to environmental changes. Our results support the propitious use of dynamic SDMs to fill species information gaps and improve conservation planning strategies. Near-real-time predictions can be used for dynamic ocean management, e.g., to examine the overlap between habitat suitability and human activities. Nevertheless, the inevitable spatiotemporal biases in sighting data from the SO call for the need for improving sampling effort in the SO and using alternative data sources (e.g., passive acoustic monitoring) in future SDMs. We further discuss challenges of calibrating dynamic SDMs on baleen whale species in the SO, with a particular focus on spatiotemporal sampling bias issues and how background information should be sampled in presence-only dynamic SDMs. We also highlight the need to integrate visual and acoustic data in future SDMs on baleen whales for better coverage of environmental conditions suitable for the species and avoid constraints of using either data type alone.
See also:
- Daily and mean weekly predicted habitat suitability of baleen whales in the Southern Ocean (2003-2019) (Youtube playlist) — (Figshare)